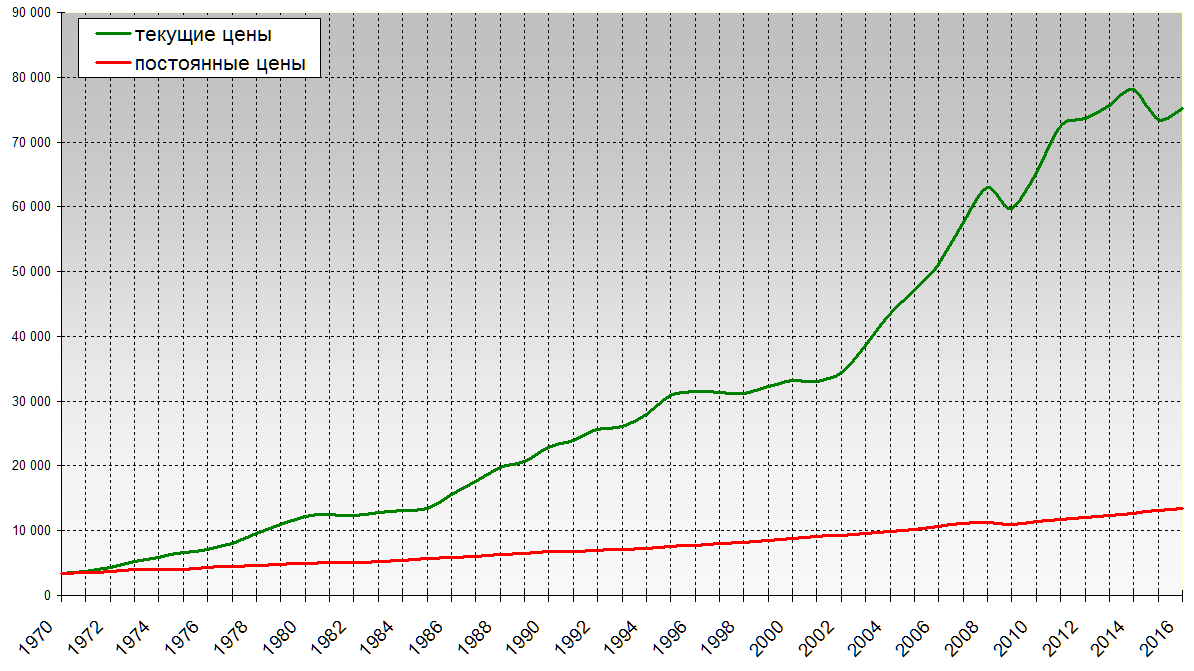
How the world GDP changed from 1970 to 2016 in nominal and constant prices relative to 1970. You can read this and a lot of other interesting information in this article. Where there is no data for 2016, data are indicated for 2013 and there is a mention of this.
For the period 1970-2016 World GDP grew from 3398.7 to 75212.7 and increased by 71817 billion US dollars, or 22.13 times; the change took place due to the increase in the world population from 3692 to 7456 million people, i.e. the population grew by 3764 million people. or 2.02 times as compared to 1970. It also grew due to an increase in GDP per capita in the world, which in 1970 was $ 921, and already in 2016 was $ 10167. The average annual growth of the world's GDP during this period amounted to 1561.2 billion dollars.
During 1970-2016. Per capita GDP in the world increased by $ 9246 or 11.04 times to $ 10167. The average annual growth of GDP per capita in the world during this period was $ 201 per year.
At constant prices by 1970, the picture looks like this. Here it should be said what constant prices are.
Constant prices: A common set of prices used to estimate the output of a firm or the economy as a whole over successive periods. The change in the real volume of activity in an enterprise or in the economy is measured by assessing the value of annual real costs and output in constant prices. Prices for a specific date or average prices for a period are used as constants. It is rather difficult to select an appropriate set of constant prices, since the type and quality of goods are constantly changing. It is impossible to find out the price of a product in 1980 if this product appeared on sale only in 1990, or, conversely, the price of a product in 1990, if its sale was terminated in 1980. The longer the period under review, the greater the share of the total volume of production, in assessing the value of which one has to face such difficulties, and the less reliable comparisons of income or volume of production in constant prices.
So the constant GDP relative to 1970 prices increased from 3398.7 billion dollars. $ up to 13487.4 billion dollars. $ in 2016. The growth amounted to 10,088.7 billion dollars. $ or it grew 3.97 times.
GDP per capita in the world in constant prices relative to 1970 increased from $ 921 to $ 1823 in 2016. The growth was $ 902 or it grew 1.98 times. This means that the purchasing power of one inhabitant of the planet has almost doubled in 46 years.

World nominal GDP, billions of dollars, 1970-2016
GDP nominal per capita in the world, dollars, 1970-2016, current prices


GDP nominal in the world by region
Share of regions in GDP, nominal value of the world,%, 2013

TOP 30 countries by world GDP 1970-2016 (nominal / PPP)
Leading countries in GDP denomination of the world 1970-2016
The rating of the world's economies is compiled annually and often carries some changes. Although everyone knows the leaders, as they say, "by sight", and here they have remained unchanged for several years. This ranking is based on the study of states. It includes almost all countries, which makes the study one of the most important for understanding the general picture of the world.
GDP as an indicator of economic development
If we calculate the entire value of goods and services produced on the territory of a particular country, we get an indicator in other words, GDP. Thus, this indicator gives an estimate of the volume of economic production in general. If, for example, we take the two countries Kazakhstan and Portugal, which occupy 46 and 47 positions in the rating, respectively (203.1 and 201 billion dollars), it becomes obvious that economic development is not reliable in relation to the position in the list. Portugal has its profits based on finished products, i.e. the entire production cycle takes place here. The basis for Kazakhstan is the export of minerals, and development occurs due to extensive production, which cannot last long. Although in recent years there have been prospects for intensification, they are episodic, and practically do not change the overall picture. So, let's move on to the ranking of the world's economy Top-5 at the end of 2015.

# 5 - Great Britain
In the past year, the brilliant work of the Parliament and the country's economic system allowed England to break into the Top 5, overtaking France. This country has a long financial and industrial history. In this matter, she has no equal. The Central Bank works exclusively, the industry exports chemicals, products of light and heavy industries, mechanical engineering plays a huge role, high technologies. The service sector and tourism are of great importance.
But the main role in the indicators belongs to the financial gurus and the Central Bank of the country, it is they who are pursuing a policy to stabilize the pound, which is reflected in the GDP indicators, and it is 2853.4 trillion. USD.

No. 4 - Germany
This country has been and remains among the leaders for many years. Germany is a post-industrial country, based on which industry accounts for only 20% of the country's GDP. Just think, many believe that the basis of development is mechanical engineering with its BMW, Volkswagen, Audi, Maybach, Mercedes-Benz, Porsche and others, light and heavy industry. But, as it turned out, the main thing is agriculture and education. Science is of great importance, it is precisely its development that allows Germany to make discoveries, new inventions, which are immediately given a go to the market. All this, coupled with the skillful financial activities of the country's government, gives 3413.5 trillion. USD and provides the 4th level of the rating "World economies of the world".

No. 3 - Japan
The chain of islands in the East, which is called the Land of the Rising Sun, has simply amazing economic performance. Considering the fact that Japan practically does not own minerals and other natural resources. For many years it has been competing with the United States in the field of high technologies and inventions, and who is the leader here is a big question. It is no coincidence that robotics exhibitions are held mainly in Japan. And everyone knows that if the purchased equipment bears the stamp “made in Japan”, this gives tacit guarantees of its quality, which is worth only one company SONY. The mentality of the Japanese is of great importance - amazing efficiency and responsibility. They have it in their blood! The economies of the countries of the world indirectly depend on Japan, more precisely on the Tokyo Stock Exchange, which influences many financial events. Traditionally, this country supplies quality cars to world markets, such as Toyota, Honda, Mitsubichi, Mazda and others, household appliances, computers and other electronics. The role of the banking system is also very important. All this gives Japan a well-deserved bronze rating. The GDP of this country is 4210.4 trillion. USD.

# 2 - China
The PRC is not a character, but it has become so into a rage of development that the world's economy, at least in most countries, has become envious of it. GDP - 11211.9 trillion. USD! This is the second position. China is confidently pushing the United States and, according to analysts' forecasts, in less than 10 years, its economy may become the first in the world, overtaking America. And this is no coincidence, the GDP growth is 10% annually, which no country in our rating can boast of. China is the undisputed leader in the export of finished products. We can say that the PRC dresses and dresses everything and what the CIS, goods from Chinese factories are presented in abundance on the markets of Western Europe and America. In the PRC industry for a long time there is no equal, but in addition to it, space technologies are developing, the construction and mining of rare metals used in electronics, which is why a huge number of companies producing modern computer technology are concentrated in China. It turns out that even the well-known company Apple located production in China.

# 1 - USA
The United States has been the incomparable leader in terms of GDP for many years in a row. The main advantage of America is the dollar, it acts as a reserve currency for more than 50% of countries in the world, and the States skillfully use this. But one should not think that only the dollar brings this country to the first line of the rating. The US industry, high and information technologies, the service market - everything develops here, and the dollar supports this development. The world's economy is directly dependent on the state of affairs in the United States. Therefore, if economic difficulties begin in America, they occur in most countries of the world. Recall at least the "depression" of the early 30s of the XX century. One of the most powerful in the history of mankind began with a decline in quotations on the New York Stock Exchange. With regards to the GDP of the leader of the rating, it is at around 18,124.7 trillion. USD and makes up 30% of the global indicator.
2016 economic miracle
If we divide the entire earnings of the state by the number of inhabitants of the country, then we get a figure and here the rating is completely different, in which the above leaders are not even included in the top ten. Qatar, Luxembourg, Singapore, Brunei, Kuwait are located from 1 to 5 places, respectively, in this rating, where the economy is determined. The world around us plays an important role here. Three out of five leaders occupy positions due to their advantageous geographic location on the coast of the Persian Gulf and almost 100% of their exports are hydrocarbons.

Economic fiasco of 2016
The tense international situation is leading to a difficult economic situation. Some countries suffered more from this than others, with the result that the economy began to decline. In this regard, there is a rating "Worst economies in the world", which is headed by Venezuela, followed by another state in South America - Brazil, in the third line is the homeland of democracy - Greece, after it Russia due to the fall of the ruble against world currencies. Ecuador closes the Top 5.
Summing up, it must be said that the world economy in recent years is increasingly entering a state of crisis. Sometimes deliberate entry, due to, for example, sanctions, sometimes occurs for natural reasons, which also greatly affects the indicators, and, consequently, the rating. Of course, the calculations can be biased, firstly, because they are calculated in US dollars, and secondly, the difference in domestic prices and the cost of material goods is not taken into account. In general, we can say that the rating of the world's economies is nothing more than a GDP rating, which does not show the real state of affairs within each country, and this is its big disadvantage.
The United States has long been the largest economy in the world. It is home to 1/3 of all millionaires and 40% of the world's billionaires. More than 50% of the planet's foreign exchange reserves have been converted into dollars. In information technology, the United States is unmatched, of the top 100 IT campaigns in the world, 75 are in the United States and 17 of them are in the top 20. GDP per capita is about 54 thousand dollars, and the average annual GDP growth is about 2.2%.

The transition to a market economy has made China one of the largest economies in the world. It is also the fastest growing economy in the world with an average annual GDP growth rate of 10%, which is a lot, for example, in the United States, just over 2%. In addition, China is considered the largest exporter in the world. If these economic growth rates continue, then by 2023, China will have the largest economy in the world, which could deal a serious blow to the United States.

In the 1970s, Japan was predicted to outshine the US economy and become the largest in the world, but as you can see, this has not happened yet, but nevertheless, it is still one of the leading economies in the world. The country has long been praised for its successes in electronics and industry. Japan is also considered one of the most technologically advanced countries in the world. GDP growth in Japan is about 1.5% per year, and GDP per capita is about 39 thousand dollars.

Germany has the largest economy in Europe, with GDP more than $ 1 trillion compared to France. Also, Germany is the second largest exporting country and one of the first in the automotive industry. GDP growth in Germany is only 0.4% per year, and per capita GDP is about 46 thousand dollars.

Just a little ahead of the UK, but on the list, as they say, every penny counts. France has long been considered a global superpower. More than 30 thousand of the largest companies in the world come from France. This country has been and is one of the most influential since the founding of the European Union. France is considered the fifth largest exporter in the world, and its GDP growth is about 0.2% per year.
GDP - Gross Domestic Product. In simple terms, this is an indicator of the value of goods and services produced by a particular state. . These are all products and services produced in the state, which are expressed in monetary terms. This indicator is often expressed in US dollars due to the fact that the US dollar is one of the most stable currencies in the world.
Today, two types of GDP are distinguished:
- Nominal is the total volume of products and services produced, measured in current prices, that is, in values that are relevant at the moment.
- Real GDP is the total volume of goods and services produced for a certain period of time, measured in basic values. The base values are called constant prices.
The difference between nominal and real GDP is that real GDP can only be affected by a change in the volume of goods produced. At the same time, the change in the indicator of nominal GDP is directly affected by the price of goods and services sold.
The ratio of the nominal to the real indicator in the economy is called the GDP deflator.
In other words, the deflator is a measure of the difference in the overall value of an economic industry.
We divide the total volume of GDP by the number of citizens living in the state.
The most developed states
The most developed countries in the world in 2019-2020 according to the UN rating of countries were 5 states.
USA
US GDP - $ 20.494 trillion. The USA received such a high GDP indicator thanks to its national currency - the dollar. This currency is used all over the world and is considered one of the most stable. 
America has entered the ranking of the countries with the highest GDP levels thanks to corporations such as Microsoft and Google. Every year in America, the country's GDP grows at a rate of 2.2%. The figure for one person is $ 62,605.
China
China with a GDP of USD 13.608 trillion. China does not leave its positions and still remains one of the leading economies in the world. According to forecasts of economists and financial analysts, China has every opportunity to oust the United States of America soon. This is possible due to the intensive growth in the value of GDP. The share of GDP in China is growing by 10% annually.
Japan
Japan ranks third. Despite the fact that economists predict that Japan will partially stop the growth of indicators, this country of the world today has a GDP of 4.970 trillion dollars.
According to statistics, the share of GDP of this republic is increasing by 1.5%. The increase in indicators is due to the established export of cars, household appliances, computers and other electronic goods. In this country, GDP per capita is $ 39,309.
Germany
The fourth place is occupied by Germany with a GDP of 3.996 trillion US dollars per year. The country was able to achieve such indicators thanks to the export of Volkswagen cars, industrial equipment and household appliances. Compared to the previous year, the share of the gross domestic product in Germany increased by 0.4%. GDP per capita is USD 48,264.
United Kingdom
The last place in the top 5 developed countries of the world was taken by Great Britain. The level of the indicator at around $ 2.825 trillion allowed the UK to oust France.
Table: top 20 countries in the world in terms of GDP after 5 developed countries of the planet in 2019 according to the UN
| The name of the country | GDP (expressed in billions of US dollars) |
| France | 2,777 |
| India | 2,726 |
| Italy | 2,073 |
| Brazil | 1,868 |
| Canada | 1,712 |
| Russia | 1,657 |
| South Korea | 1,619 |
| Australia | 1,432 |
| Russia | 1132.7 |
| Spain | 1,426 |
| Mexico | 1,223 |
| Indonesia | 1,042 |
| Netherlands | 913 |
| Saudi Arabia | 782 |
| Turkey | 766 |
| Switzerland | 705 |
| Poland | 585 |
| Sweden | 551 |
| Belgium | 531 |
| Argentina | 518 |
Indicators in the EU countries
The European Union is a very powerful and unique economic structure. In 2020.
GDP of the countries of the world for 2019
Top 10 most economically developed countries of the European Union (2018 IMF statistics):
- The most developed country in the world, a member of the European Union, is Luxembourg. Despite its small area, this country has an incredibly strong economy, as evidenced by the GDP per capita, which was equal to 114,234 USD in 2018.
- Switzerland ranks second. This country has a GDP per capita of 82,950 USD.
- Norway ranks third. The size of GDP per capita is equal to 81694 USD.
- In Ireland, the GDP per capita is 81,694 USD.
- Iceland has an indicator at the level of 74278 USD.
- In Denmark, the gross domestic product is 60692 USD.
- According to statistics in Finland, the level of GDP is 38,100 USD.
- Sweden ranks eighth with a GDP of 53,873.
- The Netherlands is experiencing a GDP growth rate. In 2018, this figure was 53,106.
- Austria ranks tenth with 51509.
Table: the level of GDP of some EU countries per capita
The "weakest" states
Forex technical analysis economists have conducted research on the forecast of GDP growth and decline for 2020. According to the findings, the list of countries with weak economies in 2020 will consist of states such as:

Forecast of the dynamics of GDP growth in other countries of the world
Table: List of Countries Expected to Increase GDP in 2020
| Name of the republic | Expected growth (expressed in%) | The likelihood of an economic crisis (expressed in%) |
| India | 7.4 | 0 |
| Vietnam | 6.6 | 0 |
| China | 6.5 | 12 |
| Sri Lanka | 6.4 | 0 |
| Philippines | 6.0 | 5 |
| Dominican Republic | 5.4 | 0 |
| Indonesia | 5.2 | 10 |
| Malaysia | 4.5 | 10 |
| Bolivia | 3.9 | 20 |
| Peru | 3.8 | 10 |
| Romania | 3.8 | 10 |
| Poland | 3.5 | 5 |
| Albania | 3.5 | 0 |
| Slovakia | 3.3 | 8 |
| Thailand | 3.2 | 5 |
| Iceland | 3.1 | 0 |
| Turkey | 3.0 | 20 |
| Bosnia | 3.0 | 0 |
| South Korea | 2.9 | 18 |
| Colombia | 2.8 | 8 |
| Mexico | 2.8 | 10 |
| Sweden | 2.8 | 10 |
| Spain | 2.7 | 5 |
| Czech | 2.7 | 10 |
| Australia | 2.6 | 15 |
| Bulgaria | 2.5 | 10 |
| USA | 2.5 | 15 |
| Armenia | 2.5 | 0 |
| Hungary | 2.4 | 0 |
| New Zealand | 2.3 | 13 |
| United Kingdom | 2.3 | 13 |
| Uruguay | 2.0 | 25 |
| Kazakhstan | 2.0 | 33 |
| Taiwan | 2.0 | 55 |
| Germany | 1.8 | 8 |
| Canada | 1.8 | 25 |
| Serbia | 1.6 | 18 |
| France | 1.4 | 10 |
| Norway | 1.4 | 15 |
| Ukraine | 1.4 | 60 |
| South Africa | 1.4 | 25 |
| Italy | 1.3 | 13 |
| Denmark | 1.9 | 0 |
| Kuwait | 1.9 | 0 |
| Chile | 2.3 | 5 |
| Azerbaijan | 2.4 | 0 |
In the EU countries, the GDP level is expected to rise by 1.7%. At the same time, the probability of a recession is 15%.
PwC has published a forecast of the world's most powerful economies until 2030. The report is titled "The long view: how will the global economic order change by 2050?" It evaluates 32 countries and projects GDP in purchasing power parity (PPP) terms.PPP is a measure that macroeconomists use to measure the economic productivity and living standards of different countries over a period of time.
PwC research shows that some countries will remain among the leaders for the period up to 2030, but a number of countries will significantly worsen their position in the ranking.
Below are the top 10 largest economies as predicted by PwC to 2030. 
The leading sector of the British economy is the service sector (3/4 of GDP).
The leading position in it is occupied by its financial component (27.7% of GDP), which determines the country's specialization in the system of international economic relations.
The second most important branch of the British economy - industry (18.6% of GDP) - is represented by two subsectors: mining (2.2% of GDP) and manufacturing (14.7% of GDP).
Agriculture, which satisfies about 2/3 of domestic needs for food, accounts for only 1% of GDP, construction - 6.1%.
Britain carries out 10% of the world's exports of services - banking, insurance, brokerage, advisory, as well as in the field of computer programming.
Engineering and transport, manufactured goods and chemicals are the main UK exports. 9.Mexico - $ 3.661 billion

The oil industry is the leading branch of the Mexican economy and the most important factor in the internal political struggle.
Foreign oil companies, which accounted for more than 90% of the country's oil production, were nationalized in 1938, with the result that the entire industry was monopolized under the state-owned Petroleos Mexicanos (Pemex).
Natural gas is an important resource for Mexico as the demand for it is growing, especially in the electricity sector (gas-fired power plants).
Mexico has gas reserves of 13.2 trillion cubic meters. feet.
Pemex has a monopoly on gas production and development of new fields.
The company is also the largest consumer of gas, accounting for about 40% of all oil consumption.
Natural gas is produced in almost the same regions as oil. 8. Brazil - $ 4.439 billion

Brazil has the largest economic potential among Latin American countries, but income differentiation is very high, as is the difference in the development of the eastern and western regions.
The most economically developed is the southeastern region, where the main economic centers of the country are located - Rio de Janeiro, Sao Paulo and Belo Horizonte.
Sao Paulo is often called the locomotive that pulls the entire Brazilian economy.
The South is the main agricultural region of the country, where rice, wheat and soybeans are grown. Livestock farming prevails in the central-western region. 7.Germany - $ 4.707 billion

The German economy is the largest economy in Europe.
Germany is a post-industrial country, where the basis of the economy (54%) is services, 45.9% - manufacturing and agribusiness - 0.1%, which employs the same number of economically active population.
The German economy is characterized by a well-developed infrastructure and a highly skilled workforce.
The German economy is organized according to the principle of a social market economy, characterized by a combination of social balance and market freedom.
This economic model presupposes largely free market forces, but the emphasis is on social security. 6.Russia - $ 4.736 billion

The economy of Russia is the sixth among the countries of the world in terms of GDP in terms of PPP.
Sectoral structure of Russia's GDP:
Agriculture and forestry - 4.2%
Mineral extraction - 10.3%
Manufacturing industry - 15.6%
Production and distribution of electricity, gas and water, other utilities - 5.2%
Construction - 6.5%
Trade - 18.4%
Transport and communications - 8.7%
Finance and Services - 17.5%
Public administration, education, health care and military security - 13.6%
As of November 2016, the decline in the standard of living of the population of the Russian Federation continued for the 25th month in a row.
As of January 1, 2017, the volume of the Reserve Fund decreased to RUB 972 billion. 5.Indonesia - $ 5.424 billion
Indonesia's economy belongs to the agro-industrial type.
Indonesia belongs to the category of the most economically promising developing countries - the so-called "Group of Eleven".
The economy, with its market character, is characterized by an active role of the state: it owns about 140 large enterprises in various sectors of the national economy, and also controls the prices of a number of goods, including basic foodstuffs and fuels and lubricants.
In the volume of GDP, the share of industrial production is 47%, services - 37.6%, agriculture - 15.4%.
At the same time, industry employs 12.8%, agriculture - 38.3% and services - 48.9% of the working population. 4. Japan - $ 5.606 billion

Japan's economy is one of the most developed economies in the world.
High technologies are developed (electronics and robotics).
Transport engineering is also developed, including the automotive industry and shipbuilding, machine tool construction.
The fishing fleet accounts for 15% of the world.
Agriculture is subsidized by the state, but 55% of food (calorie equivalent) is imported.
There is a network of Shinkansen high-speed railways and expressways. 3. India - $ 19.511 billion

India is a developing agro-industrial country with a developed industry.
In India's agriculture, great contrasts still persist: large plantations coexist with small peasant farms.
Many peasants have little or no land.
Most villages have no electricity at all. In terms of the area of irrigated land (54.8 million hectares), India ranks first in the world.
Agriculture employs 60% of the workforce and accounts for 19.9% of GDP.
The share of agricultural products in India's exports is 15%.
India is the fifth largest retail market in the world. According to forecasts, by 2020 the growth rate of the industry will outstrip the rest of the BRIC countries. 2. United States - $ 23.475 billion

The US economy is the largest economy in the world by nominal GDP, accounting for at least a quarter of the world's nominal GDP in US dollars since the end of World War II.
In terms of purchasing power parity, however, the United States is the second largest economy in the world after the PRC.
The US economy is one of the most diversified national economies in the world. At the same time, this economy is distinguished by the highest denomination of external debt in the world.
The United States has a very developed financial sector of the economy.
In addition to the New York Stock Exchange and NASDAQ, major financial centers include Los Angeles (Pacific Stock Exchange), Chicago (Chicago Mercantile Exchange) and Philadelphia (Philadelphia Stock Exchange).
The US economy has a very high level of transparency.
Dozens of different statistical reports and economic indicators are published by the US government agencies with a frequency of once a week, two, a month, a quarter, and a year.
According to the legislation, some of them are subject to revision in subsequent periods depending on the receipt of new data. 1. China - $ 38.008 billion

The economy of the People's Republic of China is the second (after the United States) economy in the world in terms of nominal GDP, the first in terms of GDP in terms of purchasing power parity.
The Chinese economy is characterized by a worldwide trend towards a decrease in the share of agricultural products in the country's GDP.
The economy of the PRC has been constantly growing over the past 30 years.
At the beginning of the 21st century, China is the world's first industrial superpower in terms of industrial production, as well as a space and nuclear power: it leads the world in the extraction of coal, iron, manganese, lead-zinc, antimony and tungsten ores, as well as timber.
On the territory of the PRC, oil, gas, and uranium are also being extracted on a large scale.
China is the world's largest producer of the absolute majority of industrial products - coke, cast iron, steel and steel pipes, aluminum, zinc, tin, nickel, televisions, radios and mobile phones, washing and sewing machines, bicycles and motorcycles, watches and cameras, fertilizers , cotton and silk fabrics, cement, footwear, meat, wheat, rice, sorghum, potatoes, cotton, apples, tobacco, vegetables, silk cocoons; has the world's largest livestock of poultry, pigs, sheep, goats, horses and yaks, and is also the leader in fish catch.
In addition, the PRC is the world's largest automaker, producing more cars annually than the former leaders of the United States and Japan combined.
More details: http://www.vestifinance.ru/articles/80963?page=11
Subscribe to us


